- Target equipment
- Energy-intensive equipment, including boilers · air compressors · chillers · pumps · fans · process heat sources
- Scope of work
- Field measurement → Equipment-level consumption analysis → Simulation → AI optimization → Improvement measure review → Investment return analysis
- Deliverables
- Energy audit report · Estimated savings by equipment · Investment cost/payback period by improvement measure · Greenhouse gas emissions reduction calculation report
- Duration
- To be agreed based on site size
Process
MEASURE · Field Measurement
We measure power, pressure, temperature, flow rate, and operating hours for each piece of equipment.
ANALYZE · Consumption Analysis
We identify inefficiencies in equipment-level consumption and operating patterns.
SIMULATE · Simulation
We transfer operating conditions to a digital model and calculate the impact of changing them.
AI OPTIMIZE · Optimization
Our proprietary AI compares scenarios to find the operating conditions that use the least energy.
VERIFY · Verification
We comprehensively verify energy savings, emissions reduction, investment cost, and payback period.
Before making a change,
we run it first.
Before modifying the equipment, we test different conditions in a digital model.
It is the surest way to avoid poor investment decisions.
These are our project counts by organization. Representative projects are shown below.
- Estimated savings
- 103.63 tCO₂ · 50 toe
- Estimated annual cost savings
- KRW 40.6 million
- Estimated savings
- 149.554 tCO₂ · 72.147 toe
- Estimated annual cost savings
- KRW 52.928 million
- Estimated savings
- 45.195 tCO₂ · 21.802 toe
- Estimated annual cost savings
- KRW 19.841 million
- Estimated savings
- 1,013.16 tCO₂ · 488.732 toe
- Estimated annual cost savings
- KRW 379.91 million
- Estimated savings
- 53.778 tCO₂ · 25.89 toe
- Estimated annual cost savings
- KRW 16.654 million
- Estimated savings
- 1,085.7 tCO₂ · 523.74 toe
- Estimated annual cost savings
- KRW 481 million
- Estimated savings
- 83,296 tCO₂ · 40,182 toe
- Estimated annual cost savings
- KRW 5,316 million
- Estimated savings
- 134.56 tCO₂ · 65.01 toe
- Estimated annual cost savings
- KRW 55 million
Field Measurement

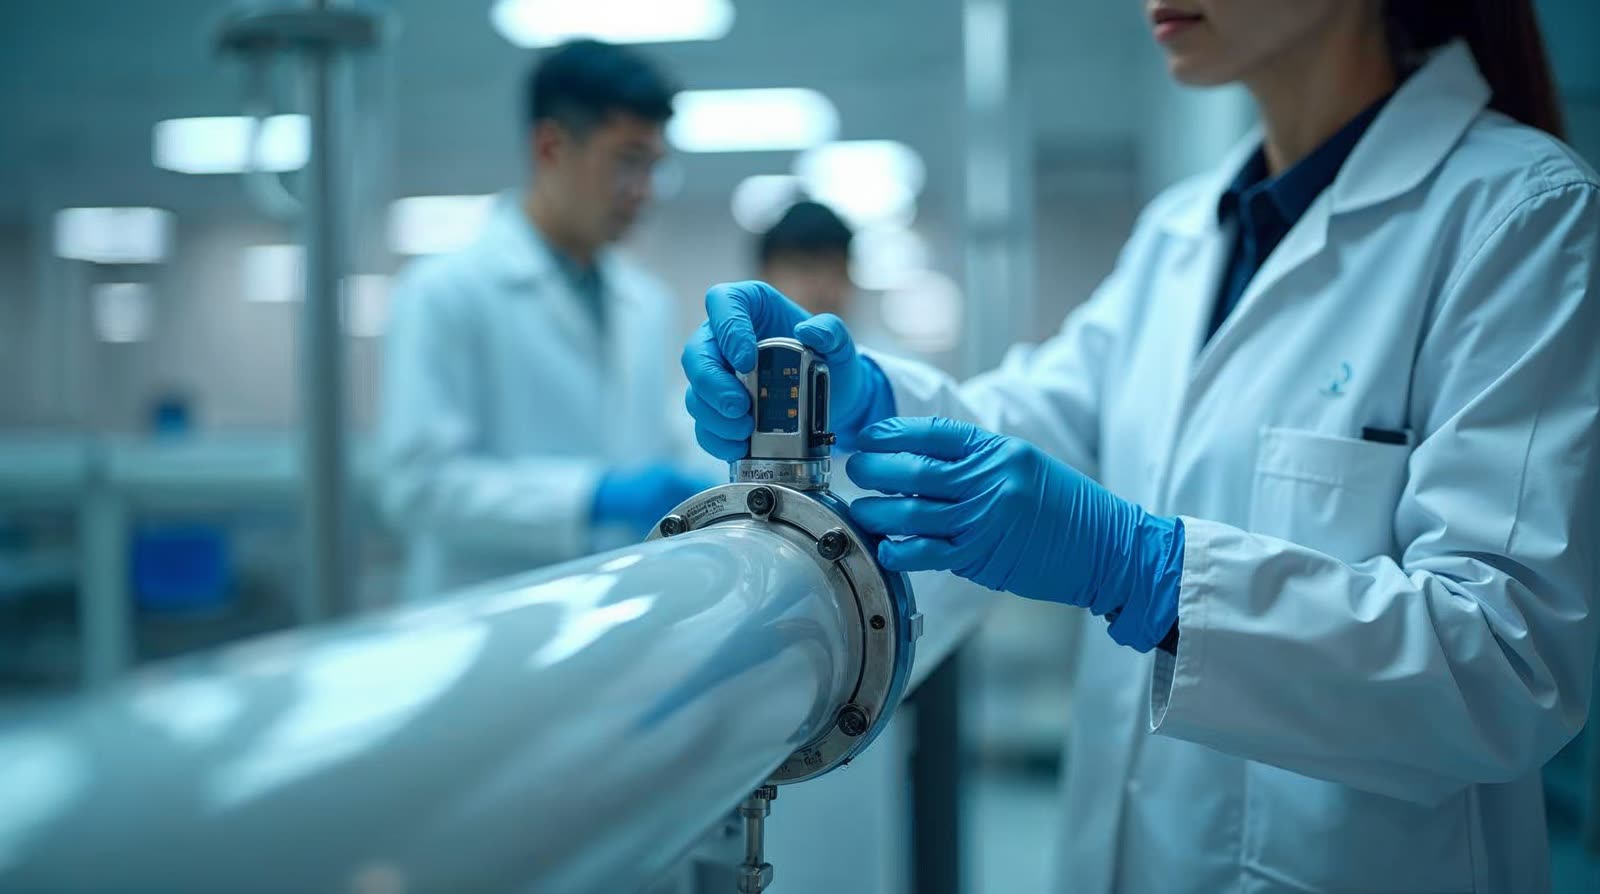
From field measurement
to investment decisions
Energy Consumption Measurement
We directly measure the power, steam, and fuel consumption of each piece of equipment on site.
We use actual operating data, not drawings or nameplate values.
Loss Identification
We analyze operating patterns and load factors to pinpoint where and how much energy is being lost.
Advance Verification of Improvement Measures
We change conditions in a DWSIM digital model to calculate cost savings in advance.
Optimal operating conditions
Our proprietary AI compares scenarios to narrow down practical operating conditions.
Investment Return Quantification
We quantify energy savings, investment cost, and payback period to support decision-making.
Greenhouse Gas Emissions Reduction Calculation
We provide an emissions reduction calculation report that can support regulatory compliance.
Required Days by Audit Grade
Audit grades are determined by annual energy consumption.
The required days and personnel are set for each grade.
Find your consumption in the table to see the required audit duration for your factory.
| Grade | Annual Energy Consumption (toe) | On-site Work (days) | Report Preparation (days) | Subtotal (days) | Personnel | Total Effort (person-days) |
|---|---|---|---|---|---|---|
| A5 | 200,000 or more | 29 | 21 | 50 | 4 | 200 |
| A4 | 100,000 to under 200,000 | 25 | 18 | 43 | 4 | 172 |
| A3 | 50,000 to under 100,000 | 21 | 15 | 36 | 4 | 144 |
| A2 | 20,000 to under 50,000 | 17 | 12 | 29 | 4 | 116 |
| A1 | 10,000 to under 20,000 | 14 | 9 | 23 | 4 | 92 |
| B | 5,000 to under 10,000 | 11 | 8 | 19 | 3 | 57 |
| C | 2,000 to under 5,000 | 8 | 5 | 13 | 3 | 39 |
Swipe the table horizontally. The required audit duration is shown on the right.
The audit institution determines the audit fee based on the required days and personnel. The fee consists of direct labor costs, direct expenses, overhead, and technical fees, and may vary by institution.
If more days or personnel than the standard are required, additional costs are determined by agreement.
What makes AERO-ONE different
- Primarily site walkthroughs and visual inspections
- Estimates based on equipment nameplates and design values
- Improvement measures based on experience
- Results known only after implementation
- Ends with report submission
- Field measurement with 24 types of instruments
- Calculations based on actual operating data
- Cost savings calculated first for each condition in a DWSIM model
- Quantified energy savings and payback period before investment
- Consistent criteria through post-improvement verification
Audit Deliverables
Complete audit results by equipment
Presented with priorities
Basis for implementation decisions
Basis for regulatory compliance
The audit does not end with a report;
ENERGY AUDIT — AERO-ONE
it sets the order of what to change first.